
Radar Siting Toolkit
Open-source QGIS plugin answering where weather radars should be sited, and what each configuration would actually see.
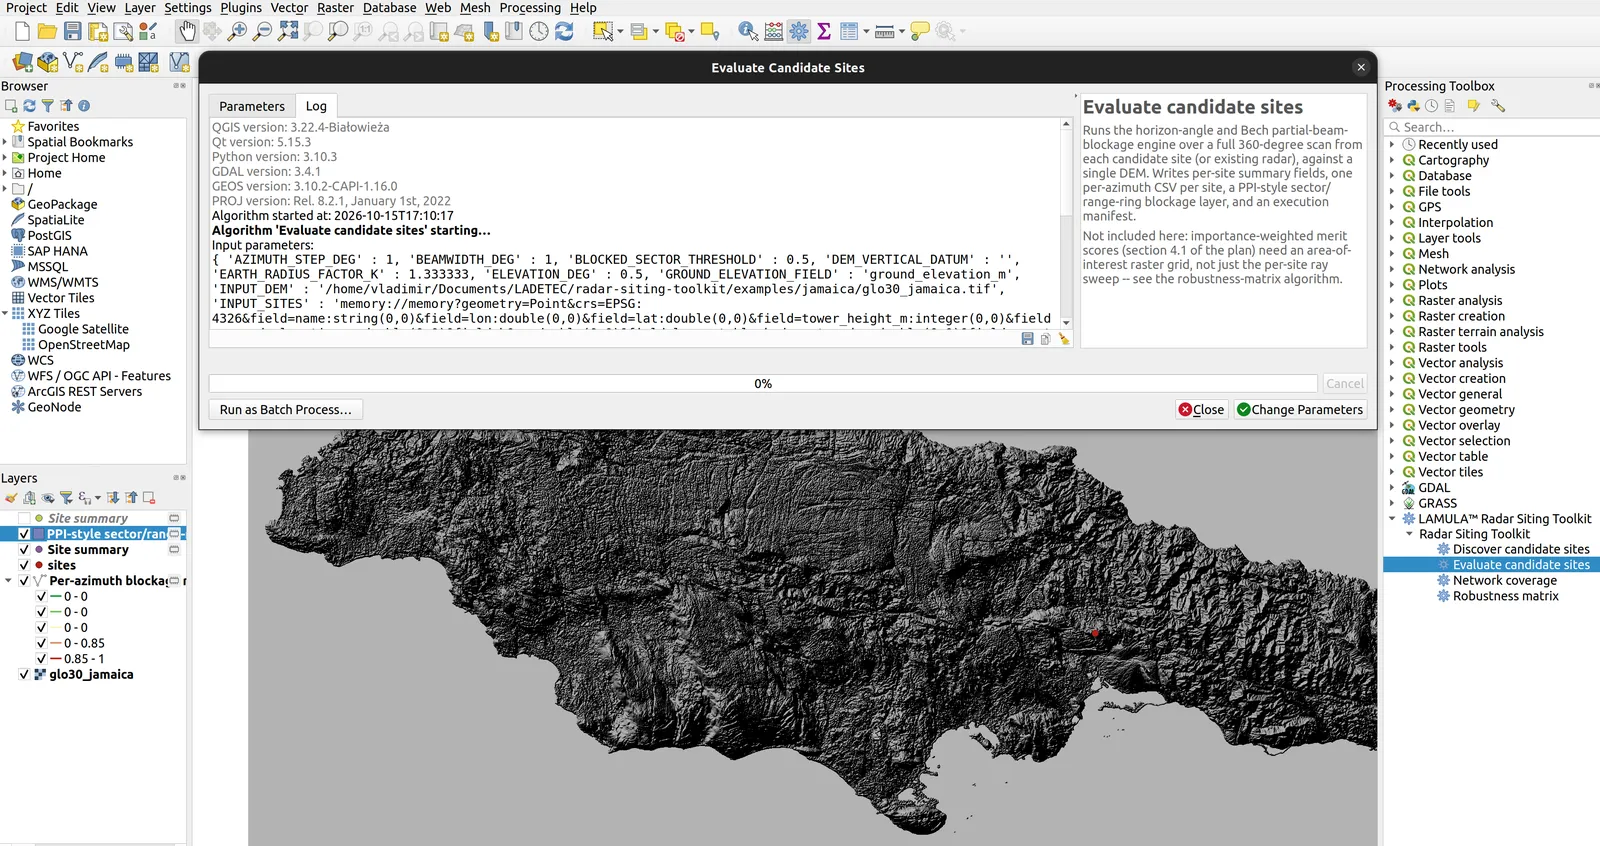
The problem. Siting a radar network is an investment decision made by a government or a donor. It needs reproducible geometric evidence, not a pretty coverage picture.
The decision that matters. For each azimuth the terrain is sampled along the ray at native DEM resolution, accumulating the maximum horizon angle seen up to each range, corrected for earth curvature by an effective-radius factor. Minimum clear elevation and minimum visible height fall out directly — a single O(N) pass per ray, with no discrete elevation-angle loop.
A detail that is easy to get wrong. Partial beam blockage is published as the range-cumulative maximum, never as raw per-bin PBB. Publishing per-bin values produces wrong maps across the entire sector behind an obstacle.
A dependency refused on purpose. Implemented in plain numpy. wradlib would pull in scipy, matplotlib, xarray and xradar and recommends a conda install — which cannot be installed from the QGIS Plugin Manager, where the users actually are. wradlib is used offline, as a validation reference only.
Explicitly out of scope
- Rain attenuation and frequency-band selection
- Real anomalous propagation — only the effective earth-radius factor is parameterised
- Sea clutter, ground clutter, RF interference, spectrum compatibility
- Quantitative precipitation estimation and nowcasting
- Tower structure, radome, wind load, electrical resilience
- Cost, lifecycle and staffing
This toolkit covers roughly 15% of a full siting study. Saying so is the point: the number that is defensible is worth more than the number that is impressive.
- Python
- numpy
- QGIS
- GDAL
- Jupyter